Hello,
I'm
Parinda Pannoon
GIS Specialist I Earth Observation I GeoAI I Cartographer I Web GIS
Geovisualization &
Geocommunication 🚀
About Me

Academic Background
-
Bachelor's Degree

Chulalongkorn University
Bachelor of Arts, Faculty of Arts
-
Master’s Degree
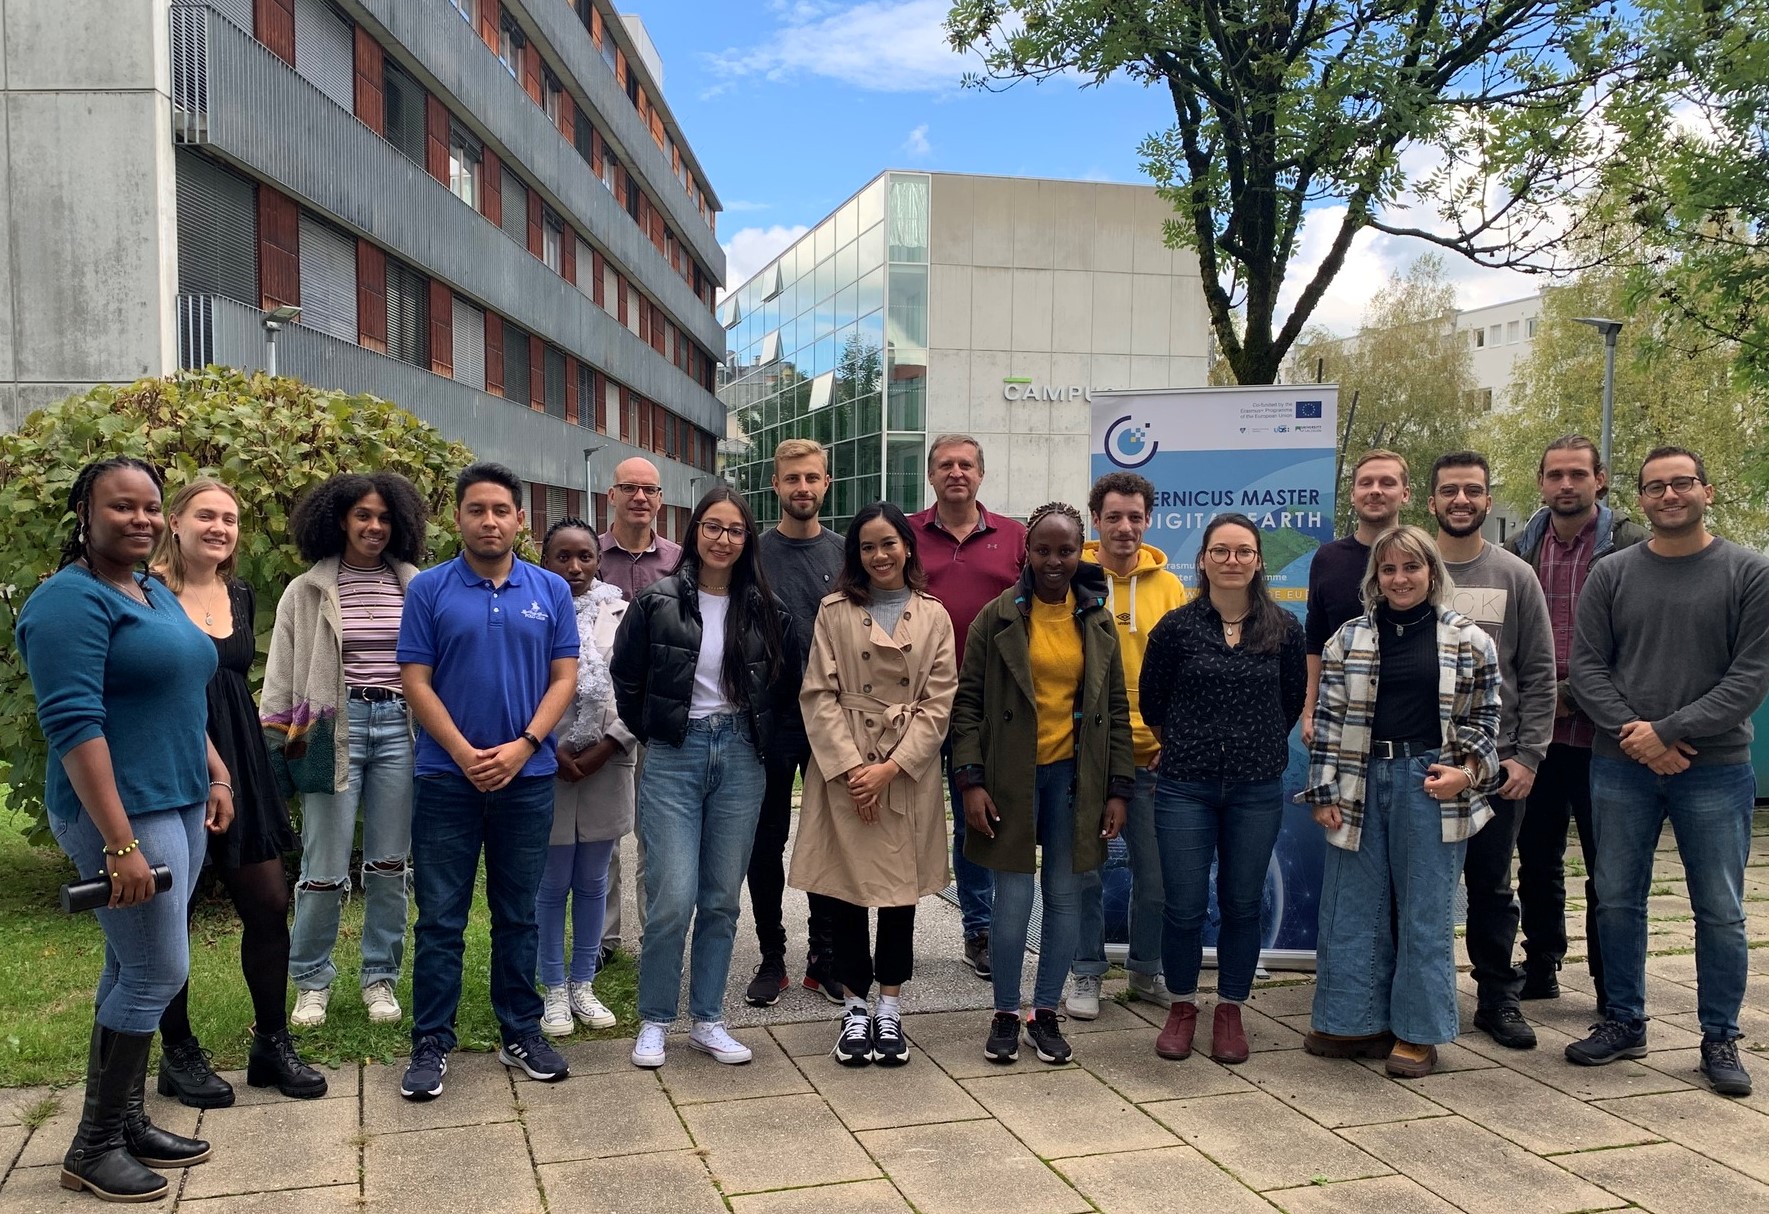
Copernicus Master’s in Digital Earth

University of Salzburg
-
Master’s Degree
Copernicus Master’s in Digital Earth

Palacký University Olomouc
Geovisualization and Geocommunication track
Professional Background
-
GIS Specialist
Research Unit, Chulalongkorn University
-
Cartographer (Contract)
PhD project, Chulalongkorn University
-
Geospatial Intern
Ubicube GmbH
-
Geovisualization/Web Developer (Contract)
Department of Geoinformatics, University of Salzburg-Z_GIS
-
Project assistant
Research unit of Cartography (TU Wien)
-
Web Developer (Contract)
Riscognition GmbH
Internship
Skills
Google Earth Engine

eCognition

ArcGIS Pro
ArcGIS Online

QGIS

PostgreSQL
Python
Adobe Ps/Ai
Front End Dev

ML/AI
Prompt Engineer
 (21).png)
Streamlit

Power BI
 (19).png)
Web Cartography
 (20).png)
Remote sensing

3D visualizations
Projects
.png)
Terrain Analysis
course: Methods in spatial analysis
This Lab aims to analyze slope, aspect, elevation, hillshade, curvature using terrain analysis. Data set consists of Thailand province, 2022 provided by Esri Thailand Content and Cave line is from Teach with GIS. For the terrain imagery layer(DEM) is provided by Esri.
Read more
.png)
Spatial Interpolation
course: Methods in spatial analysis
This Lab aims to Spatial Interpolation of Annual Precipitation 2010, Thailand which are creating Thiessen polygons area of all Rain Stations, predicting precipitation values from interpolate points, interpolating a raster surface from rain stations by IDW, Checking the results in Geostatistical wizard.
Read more
.png)
Surface Runoff Analysis
course: Methods in spatial analysis
This Lab aims to analyze Analysis of surface runoff in Palisades Reservoir, Idaho, United State which are Creating Sink filling, Flow Length, Flow direction, Flow accumulation, Pour Point and Watershed.
Read more
.png)
Selection and Aggregation Analysis
course: Methods in spatial analysis
This Lab aims to analyse intersects condition where Province, District, Sub district intersect with the flood areas, Topological neighbours of flooded provinces and Summarize Within. Then aggregate Points by counting the number of Rain gauge stations in the province areas.
Read more
.png)
Assessment of Solar Radiation
course: Methods in spatial analysis
This Lab aims to to determine overall solar radiation in study area including analyze on each rooftop. Then I analyze zonal statistics to see an effect of sun energy on different land uses.
Read more
.png)
Semantic Earth Observation Data Cube Analysis
Course: Big Earth Data Concept
This model aims to analyze the correlation between vegetation and bare soil areas and also cloud percentage during 1st January 2018 – 1st January 2019. There are 3 entities, vegetation, barren land and cloud by using Sen2Cube.at, a physical-model-based, spectral categorisation and additionally derived information.
Read more
.png)
Traveling in Thailand
course: Geovisualization and Advanced Cartography
This Lab aims to show tourist attractions and traditional cuisine in Thailand through interactive story map in ArcGIS Story map.
Read more
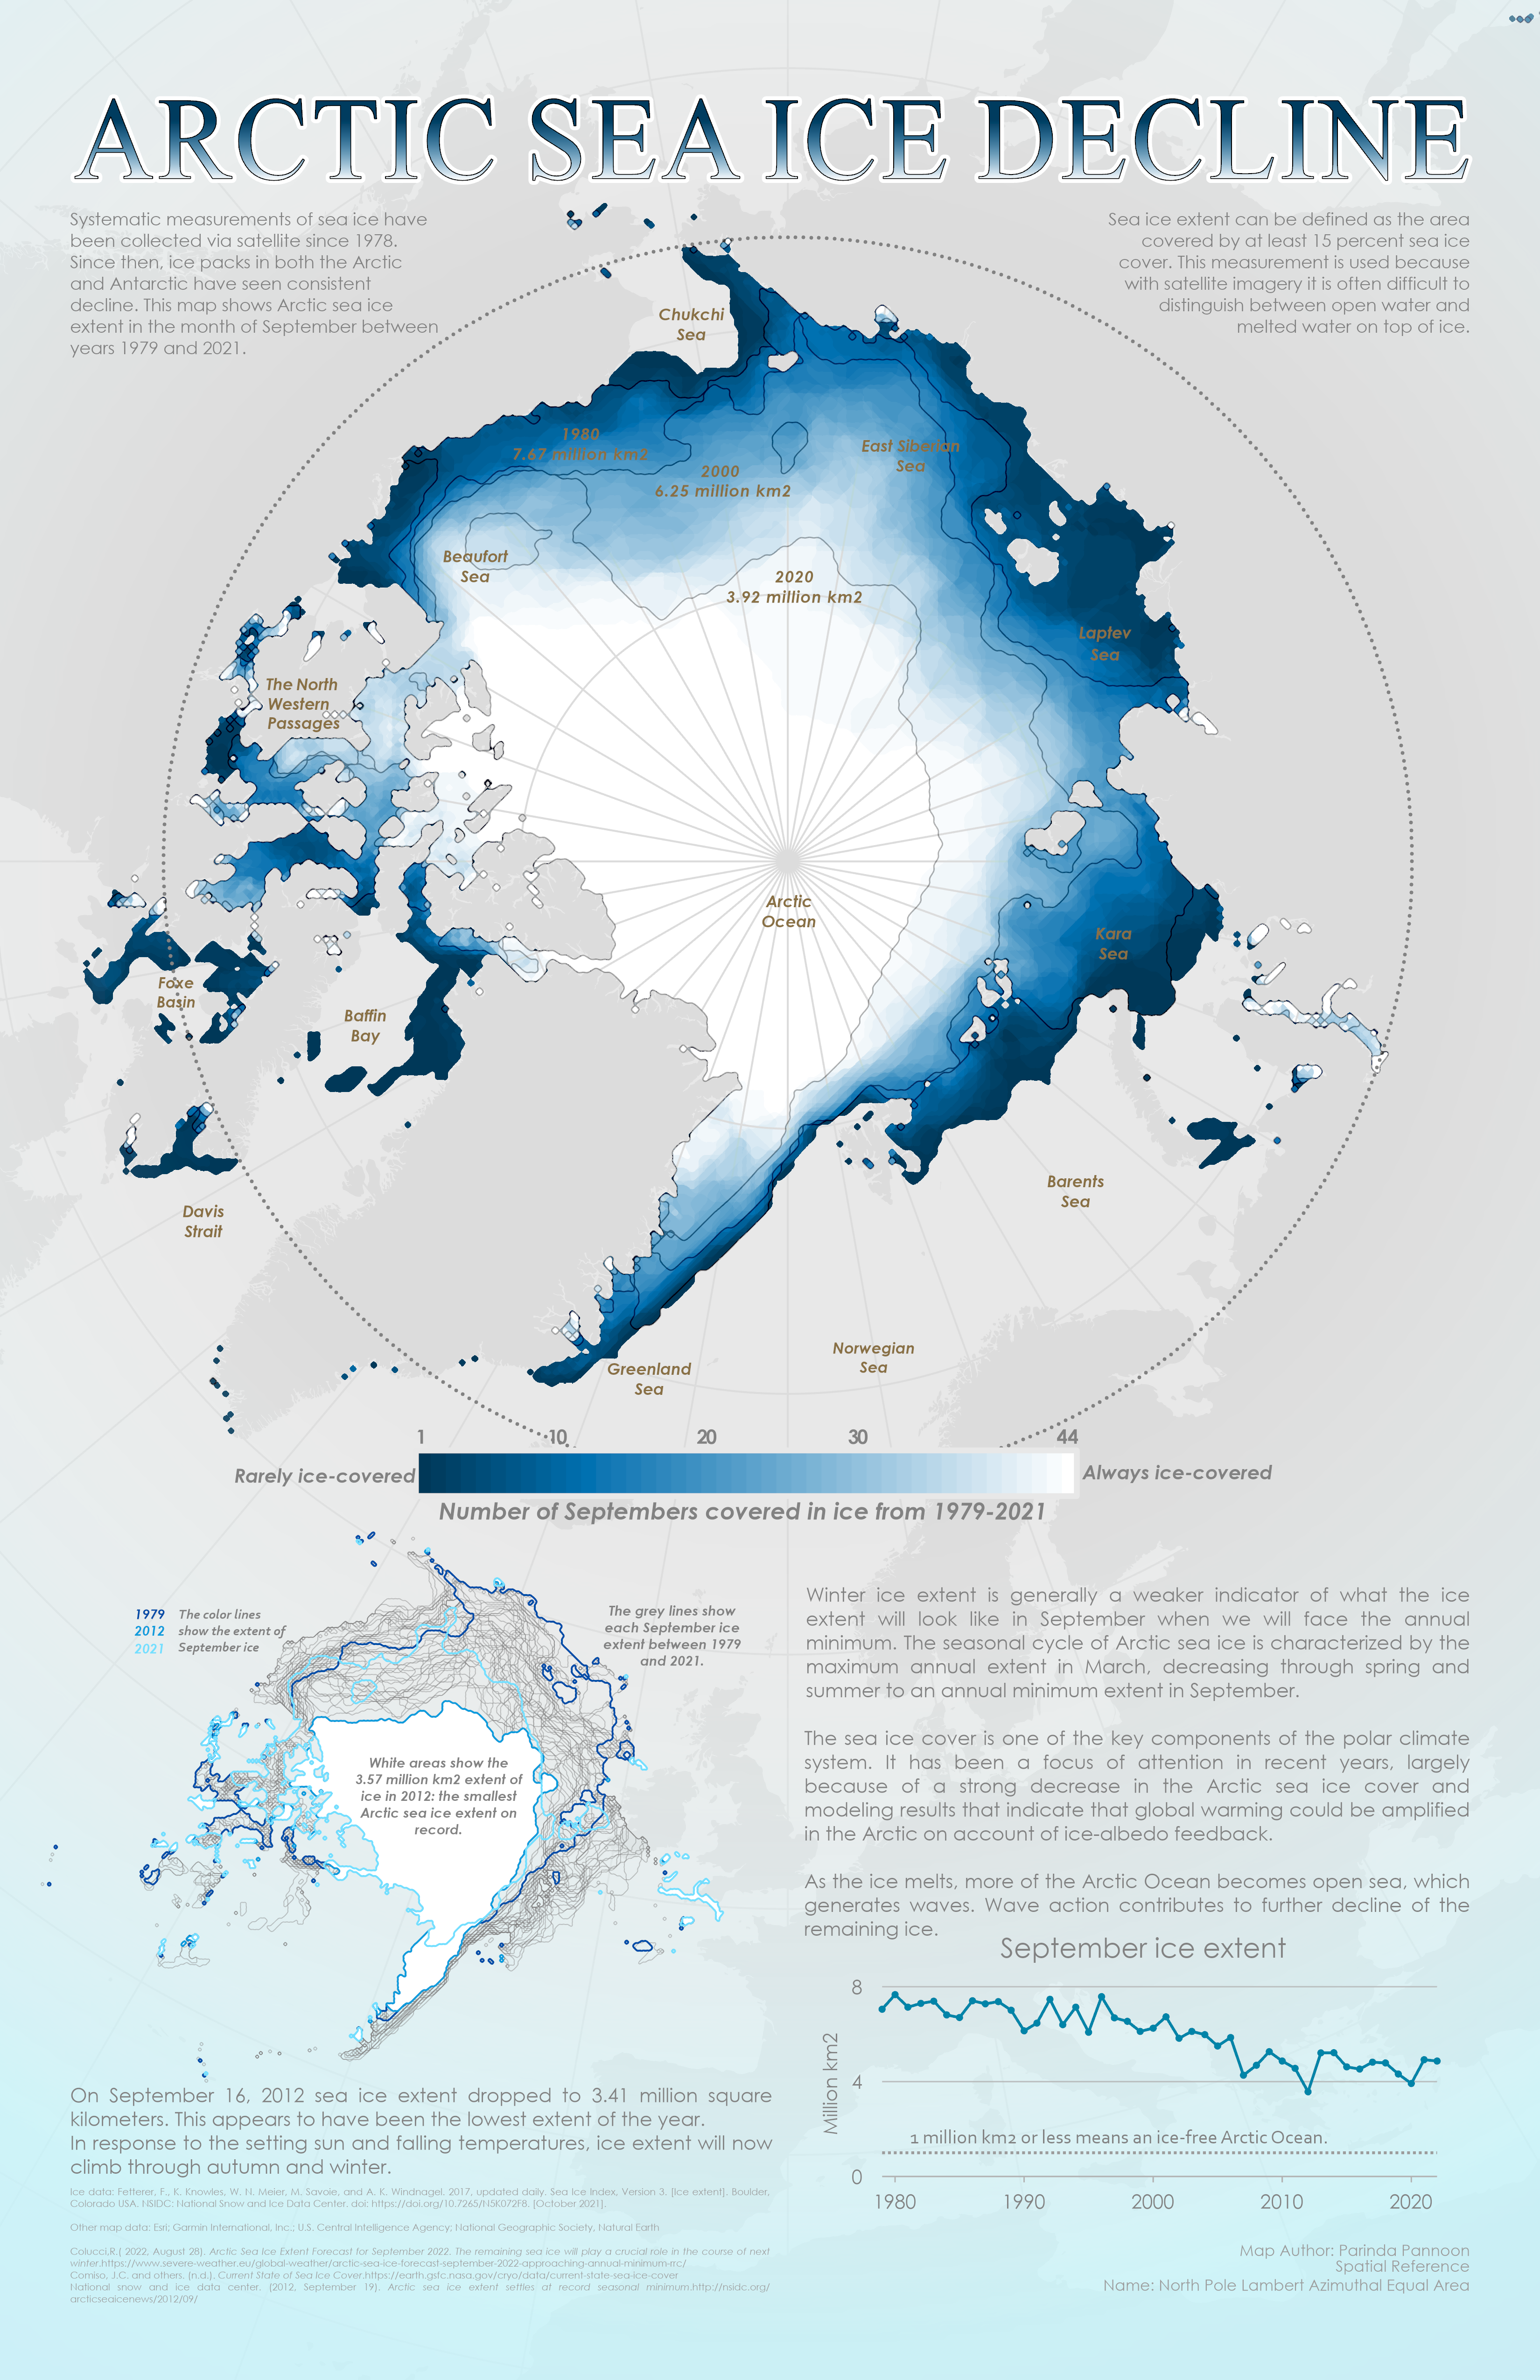
Arctic Sea Ice Decline
Course: Geovisualization and Advanced Catography
The following poster map shows an educational poster-style map that communicates the ongoing loss of sea ice in the Arctic since 1979-2021.
Read more
.png)
Chicago crime 2021 Dashboard
Course: Geovisualization and Advanced Catography
The main objective of this dashboard is to provide Street Crime Data in Chicago City. It is possible to check what type, when, where the crime was committed, whether the person was arrested or not. This is in order to provide information to citizens and tourists so they can be more careful when walking through the city.
Read more
.png)
MODIS/LANDSAT Temperature, NDWI and Vegetation Indices
Course: Big Earth Data Concept
The repository from Google Earth Engine provides code of Temperature,NDWI, EVI and NDVI changing over time of different areas Galveston(USA), Paris(France) and Kalasin(Thailand).
Read more
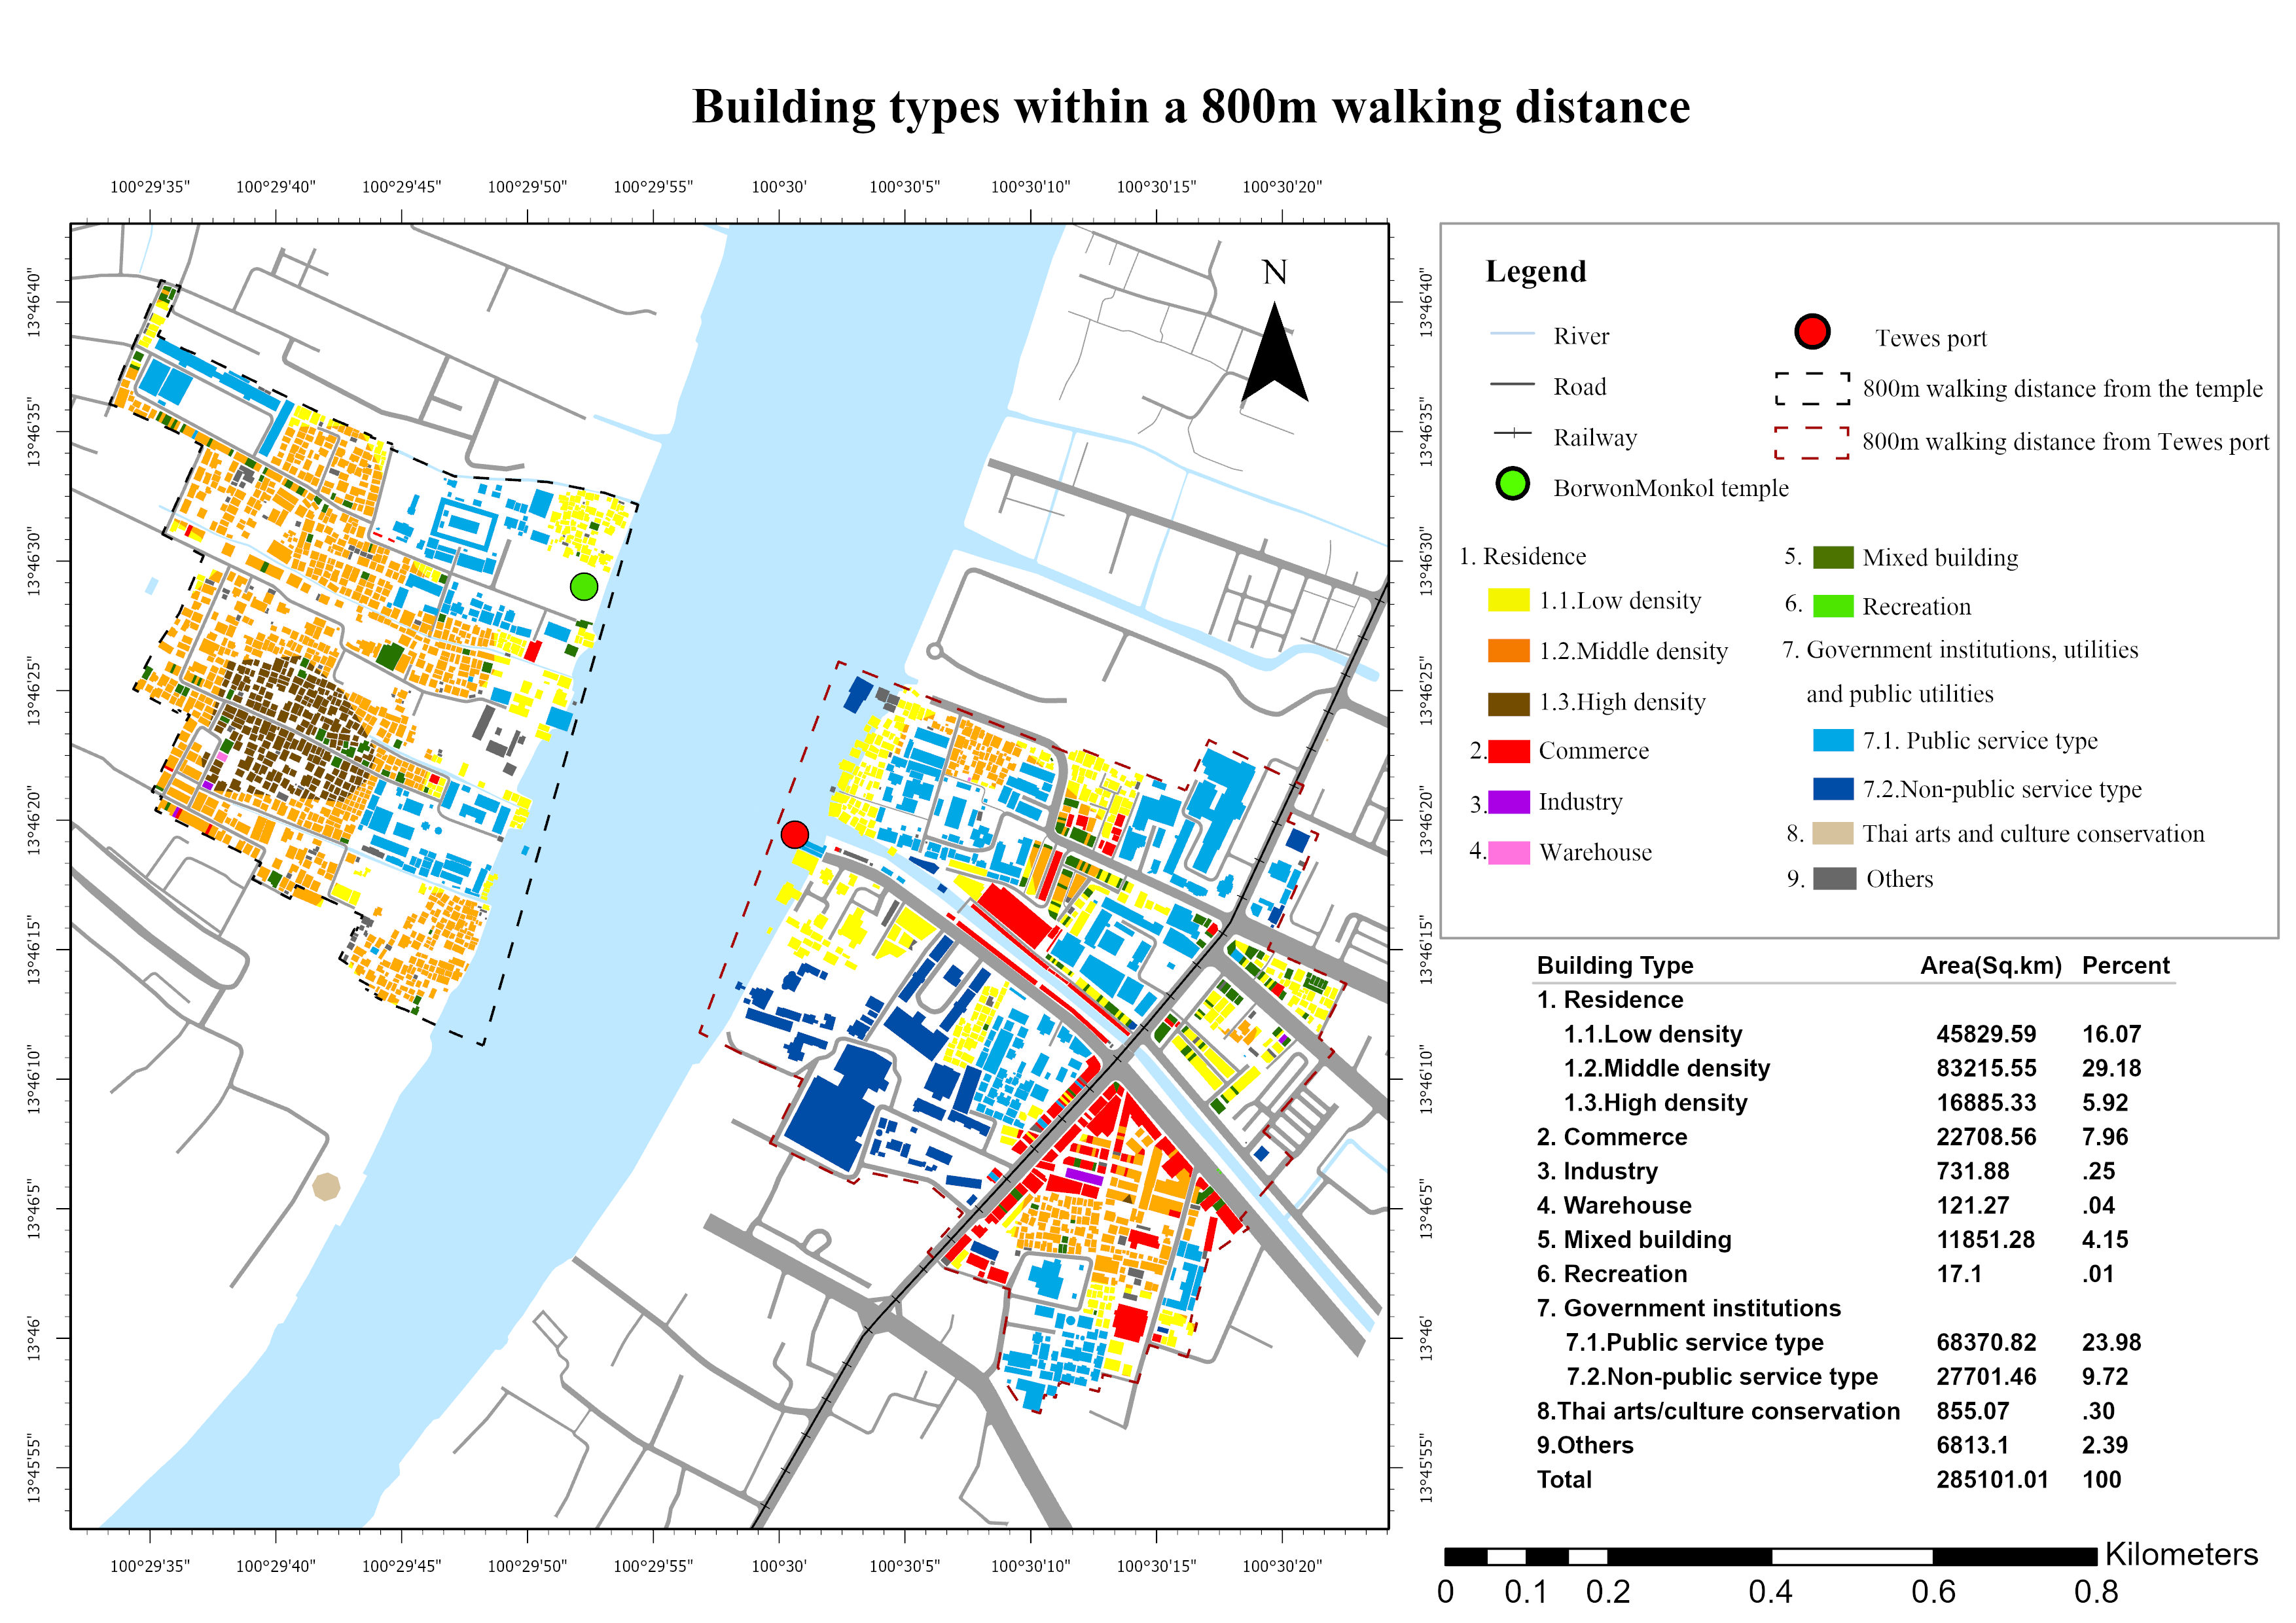
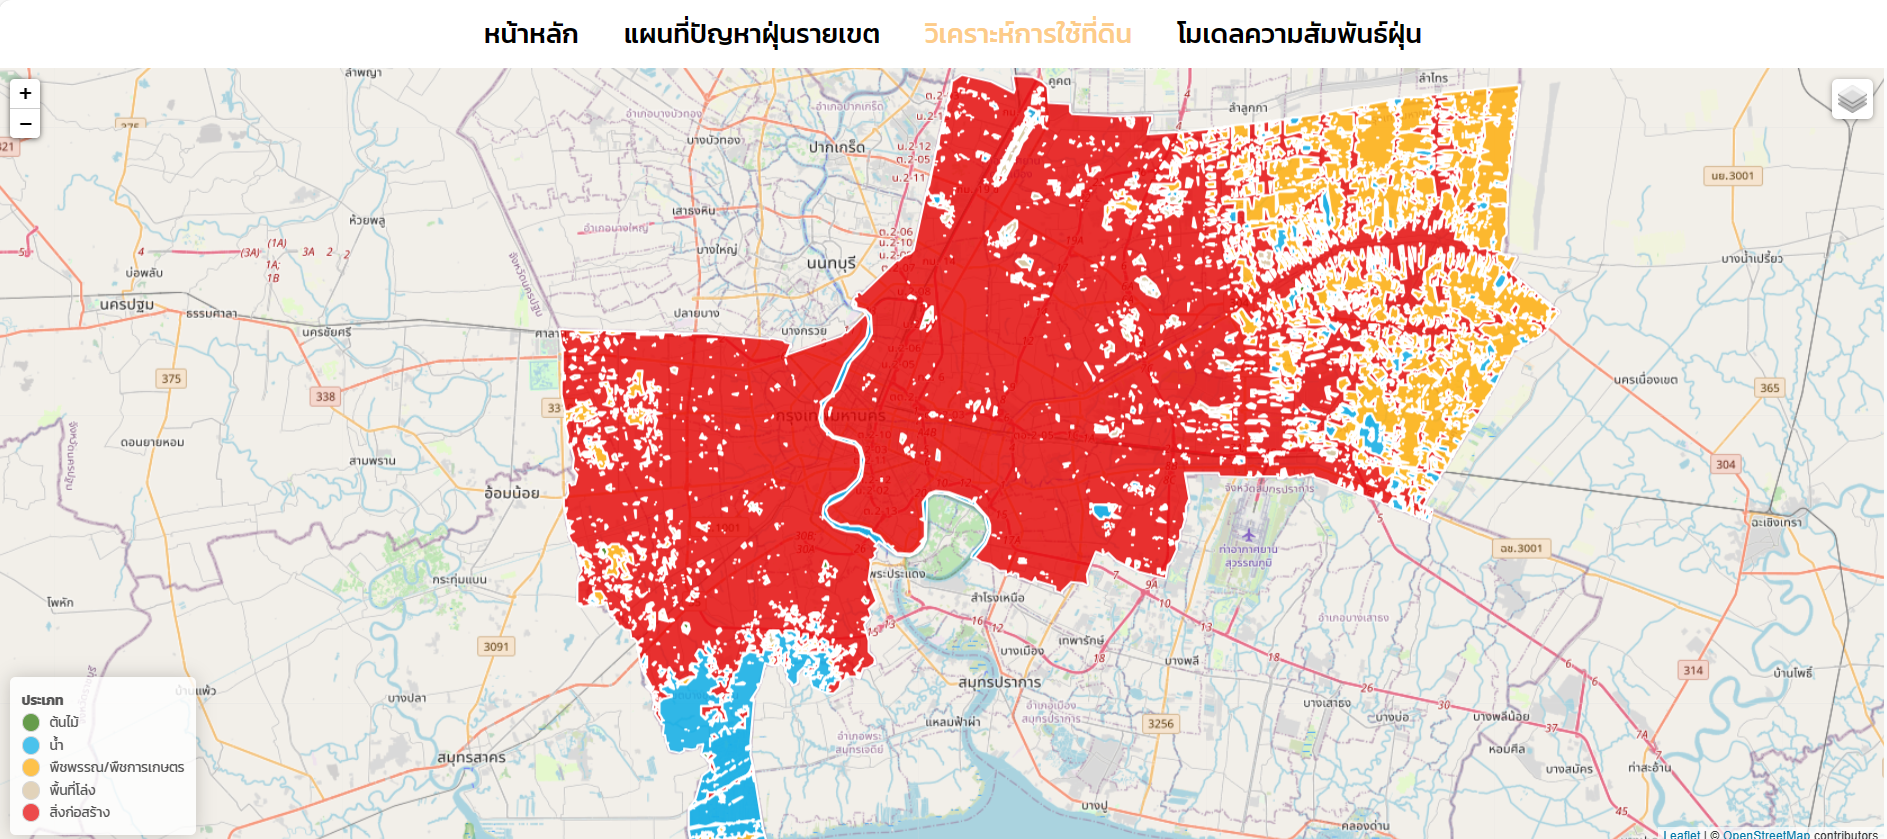
Building Types Classification
Project: Waterfront spaces around temples in Bangkok
The following maps shows land use around Borwon Mongkol temple in Bangkok which is classified into 9 main classes. The area is also analysed building types within a 800m walking distance by Space Syntax software and performed density of residential building types.
Read more
.png)
SQL Spatial query
Course: Spatial Database
The following work shows basic GIS operations, conducting them within PostGIS, and how to perform database queries directly from QGIS which makes use of the pgAdmin.
Read more
.png)
EO-Browser
NDSI-Visualized, Sentinel 2
The Sentinel-2 normalised difference snow index can be used to differentiate between cloud and snow cover as snow absorbs in the short-wave infrared light, but reflects the visible light. Results from this script will present snow cover in bright vivid blue which derived from a ratio of two bands, one in the VIR (Band 3) and another one in the SWIR (Band 11).
Read more
Geovisualization Portfolio
Course: Desktop Publishing in Cartography
This semestral project aims to create my work in cartography and geovisualization. The maps are created by ArcGIS Pro, QGIS and combined with graphic design software such as Adobe Illustrator and Inkscape. I have learned to transform complex data into insightful and visually appealing maps by using various thematic methods and graphic design software.
Read more
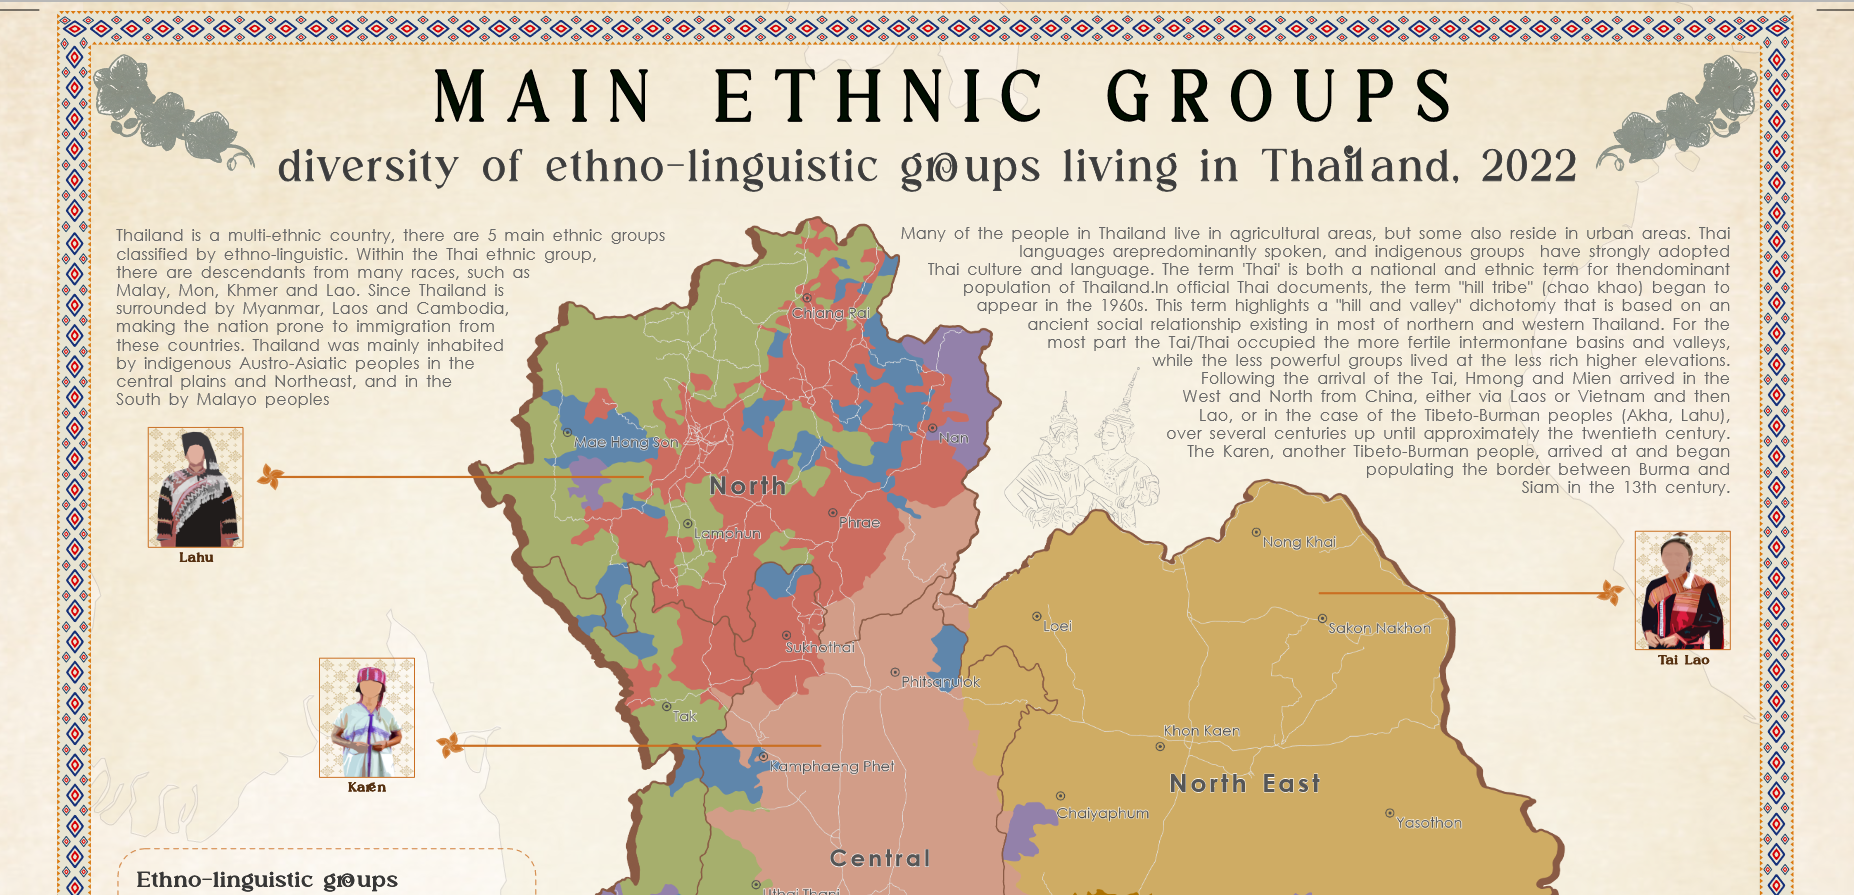
Map Poster
Course:Design in Geovisualization
This semestral project aims to design the map poster of main ethnic groups in Thailand. The main map shows 5 main groups; Tai-Kadai, 2.Mon-Khmer, 3.Malayo-Polynesian, 4. Tibeto-Burman and 5. Miao-Yao which are classified according to ethnolinguistics. The second map is the total number of ethnic groups located in each province and the third map shows the first three ethnic most found in each region of Thailand.
Read more
.png)
3D UNESCO World Heritage Places
Course: Web Cartography
This semestral project aims to create 3D models of UNESCO World Heritage Places by Cesium ion and Cesium story. The 3D models are derived from Sketchfab. The models are georeferenced in Cesium ion then publish the interactive 3D map in the storymap
Read more
.png)
Network Analysis
course: Methods in spatial analysis
This Lab is to analyse Nearest distance, Nearest time, Plan route, Drive time area for library locations in Miami-Dade, U.S.A.
Read more
.png)
Distance Analysis
course: Methods in spatial analysis
This Lab is to analyse Point to point distance-Nearest analysis, Distance to line, Service area of Nursing homes for the elderly in Salzburg, Austria.
Read more
.png)
3D terrain from Orthophoto and DEM
course: 3D Visualization
This project aims to visualize terrain from DEM and overlays orthophoto on top. Qgis2threejs aims to visualizes DEM and vector data in 3D on web browsers. You can build various kinds of 3D objects and generate files for web publishing in simple procedure. In addition, you can save the 3D model in glTF format for 3DCG or 3D printing.
Read more
.png)
Wildfire event Dashboard
Developed by using Folium, Plotly hosted on Streamlit
A dashboard in Python with Streamlit using Folium and Plotly libraries. The tool combines an interactive map of wildfire event in Portugal along with data visualizations. Streamlit allows developers to set a default color scheme through a config file, enhancing visual appeal for maps, charts and consistency in colors and fonts. Then the prototype deployed and linked to the app code in the Github repo.
Read more
.png)
Power BI dashboard; ArcGIS Online
The geographic layers used ArcGIS Maps in Power BI to visualize a simple choropleth map. The Q&A feature uncovers new information from the data. Power BI Desktop can be connected to Azure Blob Storage which is beneficial for accessing and visualizing large datasets efficiently. We can publish maps by embedding URLs into our web application.
"Read more"
.png)
An interactive map of Ethnic Groups, Thailand
Developed by using svg graphic format and JavaScript
A map-based dashboard that I created with SVG file. SVG is an XML-based vector image format easily customizable with styles, colors, and labels to suit any specific needs. This map shows multiple variables between choropleth and graduated symbols of Ethnic Groups in Thailand, and each vector element can be assigned data, allowing users to click, zoom, and hover to get detailed insights.
Read more
.png)
Connecting Geospatial data from PostgreSQL to Python
Developed by API-Psycopg2
Connecting PostgreSQL leveraging GeoPandas can make your data more efficient and manageable with large shapefiles. The first step is to create a connection with database parameters - username, database name, password, host and port. Then I created SQL command to query attribute data, I queried multiple layers which are fire spots, district boundary, and LULC. Once the data is stored in PostgreSQL, it read into a GeoDataFrame for analysis or visualization.
Read more
.png)
Fetching API data from PostGIS to frontend
Developed by using Flask, API
This Flask app utilizes PostgreSQL, with the PostGIS extension. The app manages 2 geographic data: polygon geometries and point coordinates representing specific hurricane areas and locations. SQLAlchemy or GeoAlchemy2 handle spatial queries, they communicate with the Flask backend through fetch API calls. Users can query 3 parameters through app routes; month, date and time when the hurricane occurred.
Read more
.png)
Monitoring Water Extent Using Earth Observation Data: Baringo Lake, Kenya
This study aims to estimate the water extent of Lake Baringo in Kenya over the period from 1984 to 2021 using WOfS in Digital Earth Africa platform and to analyze the correlation between the expansion of water and the rainfall rate. The last step is to assess the effects on land use and land cover around the study area.
Read more
.png)
Forecast albedo
Forecast albedo data on September from data ‘ERA5-Land monthly averaged data from 1950 to present’. We can compare the fraction of solar radiation reflected by Earth's surface over a given period of time. In addition to utilizing this data API, users can visualize and work with GRIB file formats with python libraries.
Read more
.png)
Database backend for city festival
course: Spatial Database
This project aims to serve a database backend to organise the facilities, positions, opening times, employee of the festival. Creating geodata in PostgreSQL and PostGIS which enables to be query and generating an entity relationship diagram as a physical model that illustrates how entities relate to each other as well as data type and keys within a festival model.
Read more
.png)
An Analysis and Assessment of Water Adequacy for Economic Crop Cultivation in Rayong Province
Journal Publication
This research evaluates the adequacy of rainfall and irrigation for economic crop cultivation in Rayong, Thailand. The methodology starts with an estimation of the water demand of 23 crop types at each growth stage, based on the FAO Penman-Monteith equation for crop evapotranspiration.
Read more
Master's thesis
Implementation of Artificial Intelligence for Creating Maps
The main objective of this study is to evaluate the quality of employing AI in map generation and visualization and to compare the results with traditional cartographic techniques. Map results are developed by Prompt Engineering which is a crucial methodology that can enhance large language models to produce high-quality outputs.
Read more
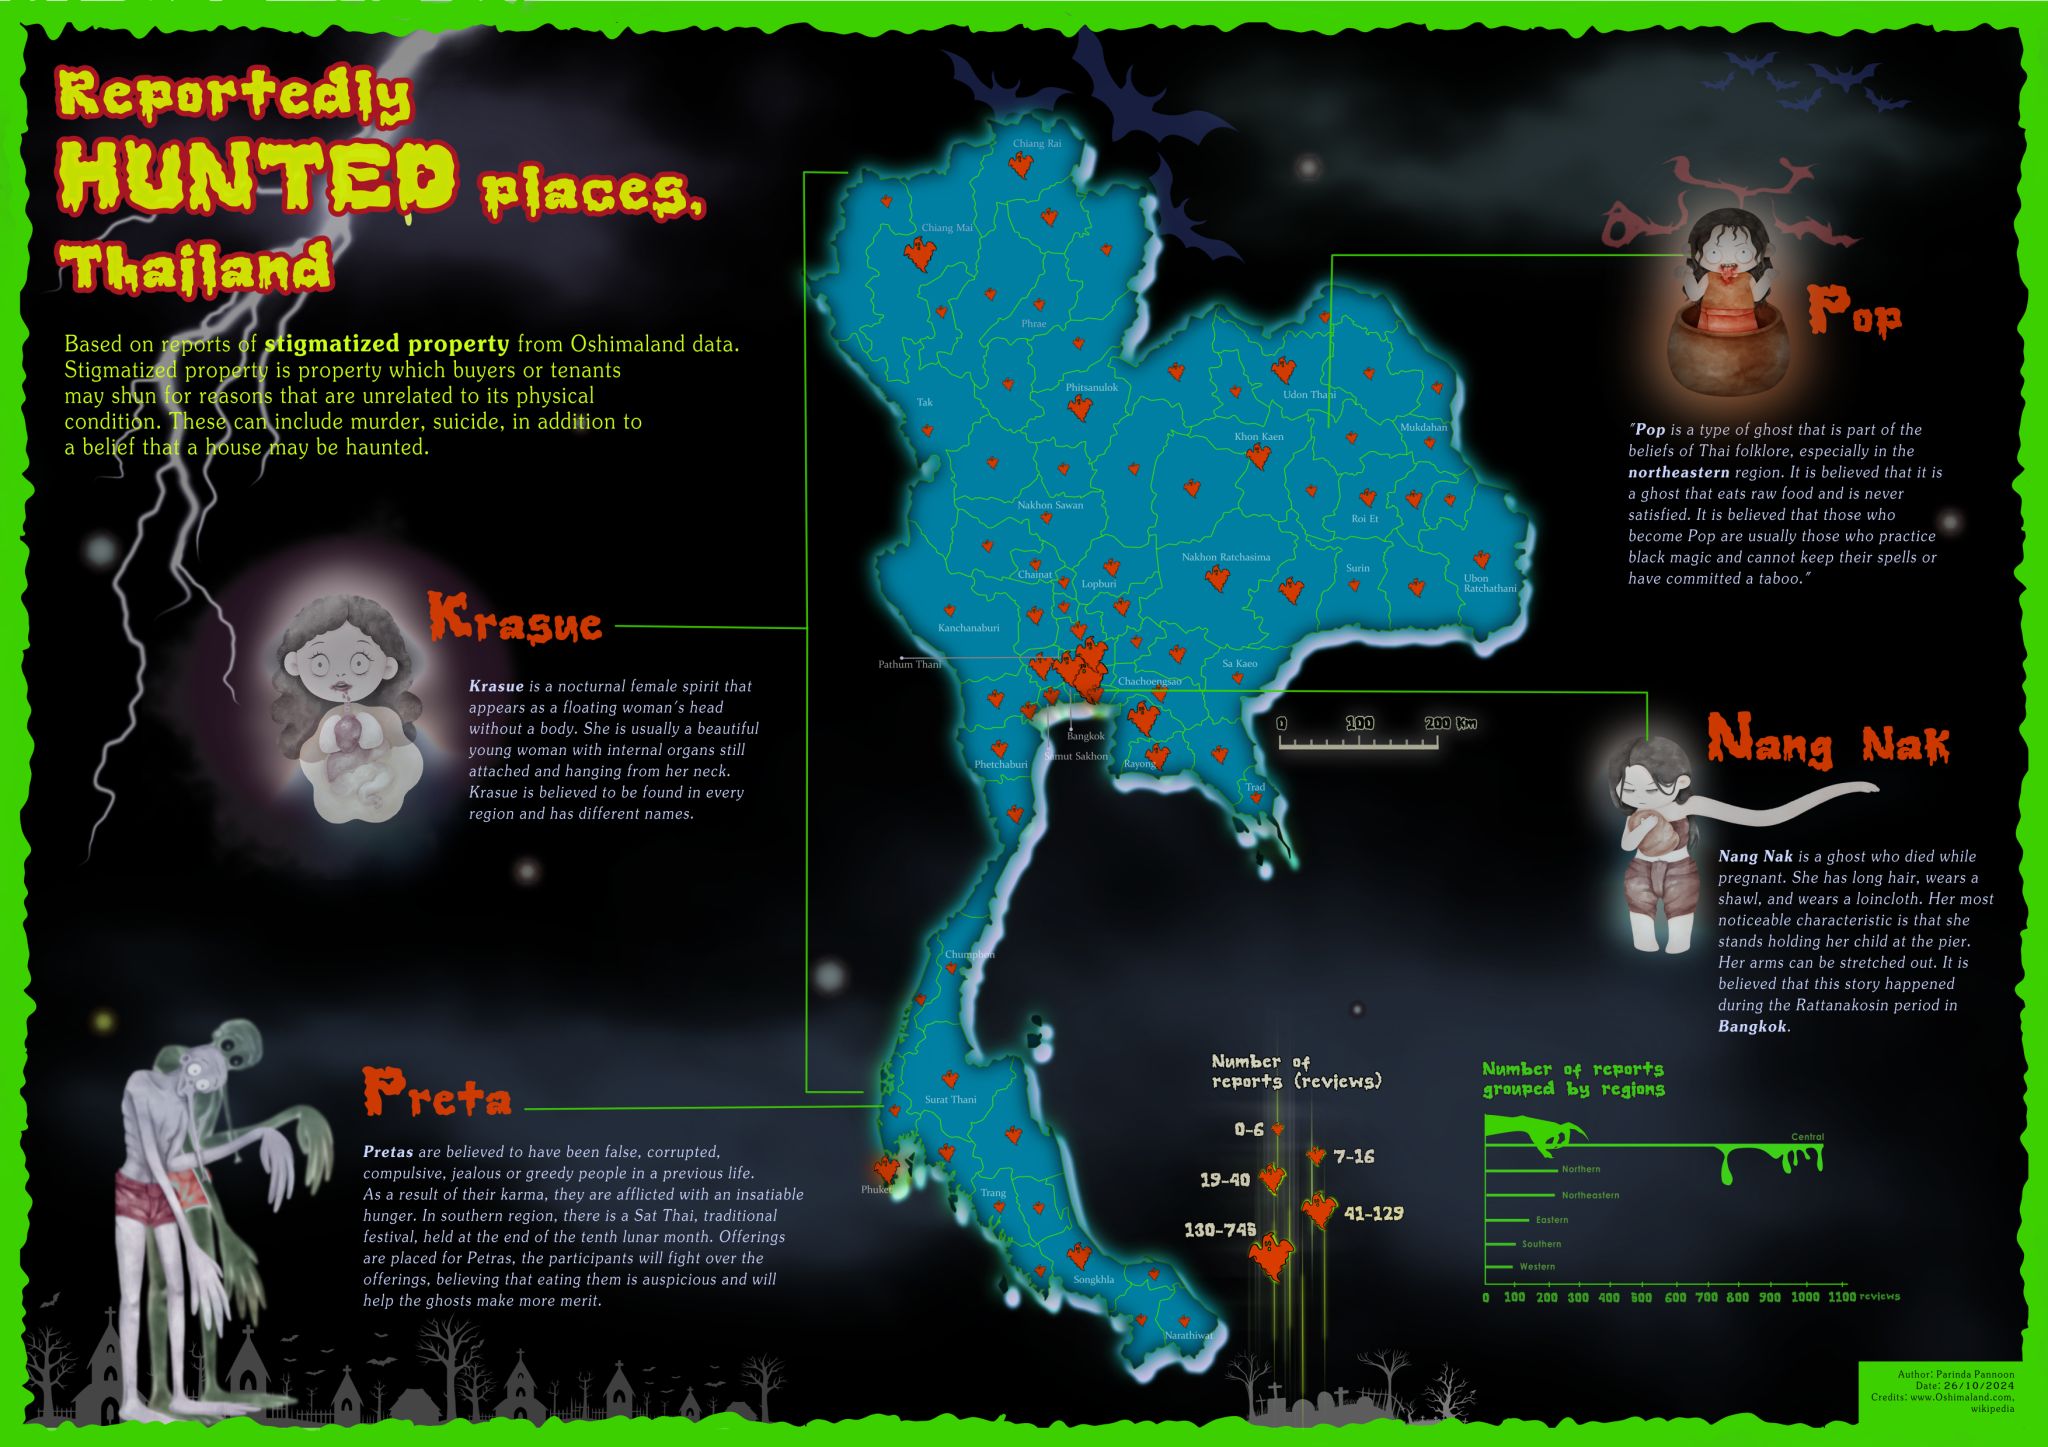
Spooky map
Globie’s Haunted Map House, Halloween 2024
I created my spookiest map for a chance to be featured in Globie’s Haunted Map House. This map shows the number of haunted locations in each province in Thailand, the data are derived from the Oshimaland website which is the posting site for stigmatized properties. Additionally, the map illustrates spirits according to the beliefs of each region.
Read more
.png)
Interactive Kepler.GL map
Kepler.gl and Geo Data Viewer
Visualizing an interactive map with Kepler.gl and Geo Data Viewer! 🌍 This map is built on Geo Data Viewer extension in Visual Studio Code which supports Kepler.gl to generate and view maps on the VS code interface. This map visualizes earthquake events from 2010 to 2024 based on their geographical locations, magnitude scales and magnitude types. Time playback allows users to visualize how the events change over time.
Read more
Achievement & Awards
.png)
ML4Earth Hackathon 2022
The winner, 3rd place
Topic : Crop yield prediction with remote sensing and machine learning and exploring relations with explainable AI.
Read more

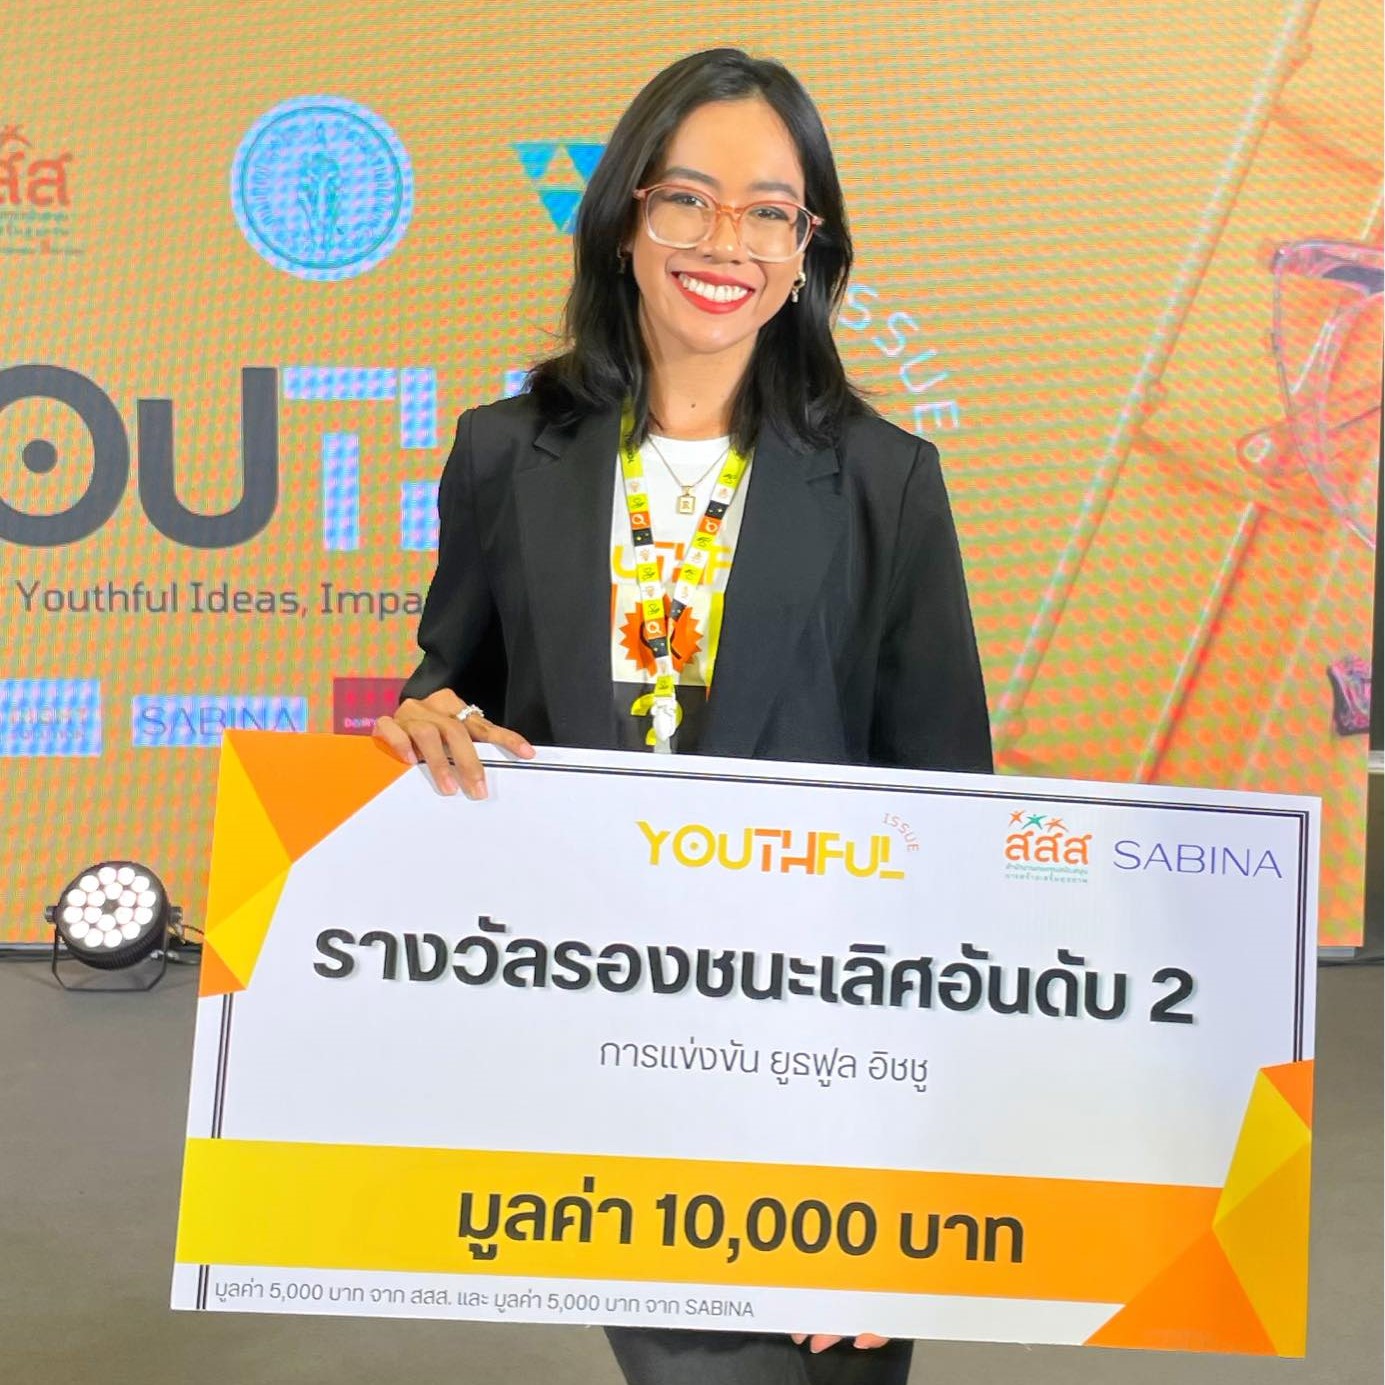
Foresight DRM: Disaster Mapping Hackathon 2023
The winner, 2nd Place
Topic: find a solution with a positive impact on hurricane management in the Bahamas.
Read more
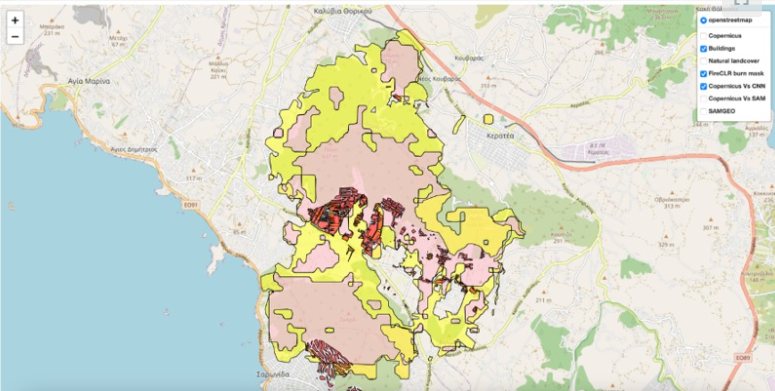
STEMist Hack2.0
The winner, 2nd Place
Topic: Burned area detection in Attica, Greece
Read more
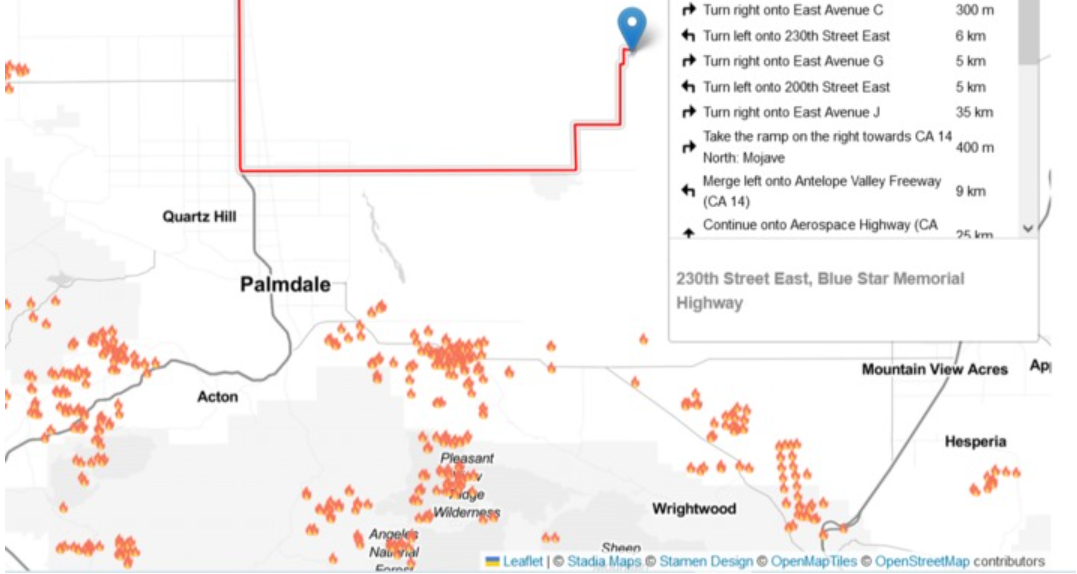
Tech Optimum Hacks 2023
The winner, 1st place
Topic: Routing and navigation of fire incidence in California, USA
Read more
ML4Earth Hackathon 2023
The winner, 1st place
Topic: Using physics-aware machine learning to model and forecast flood events
Read more
Innovation Solving PM2.5 Problem Hackathon
The winner, 3rd place
A monitoring platform that shows in-depth information on PM2.5 in each district to help the government assess problems in specific areas.
Read more

NASA Space Apps Challenge
Participant
ECLIPSE STORY Perspective is Everything: Story telling 3D website about Eclipse
Read more
.png)
Breast cancer segmentation by ML integrating Docker
These containers are designed to provide the tools to help segment the tumor cells out of another which helps a doctor to locate the tumor cell. We have provided the interface for users who would like to segment the cell images and we also provide the fast api container for the developer who would like to implement our api.
Read more
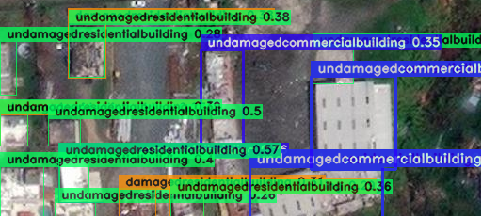
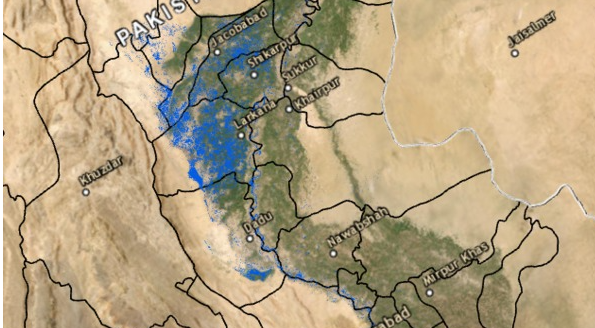
2023 EY Open Science Data Challenge
Global Semi-Finalist (Top 10)
Implementation of YOLO-NAS for damaged building detection and suggested plan for coastal resilient management
Read more
Activities
.png)
Mapathon @ TU Munich: Mapping At-Risk Regions with Awesome Mappers
On 22 July, 2024, the mapathon event was held by YouthMappers at TU Munich in collaboration with Geoawesome, German Red Cross, and Runder Tisch E.V. The event engaged in mapping critical areas for disaster risk reduction in Portugal, understood the Humanitarian OpenStreetMap Team (HOT) and its importance. In a Mapping Contest, I won a mapper award which the most contributions in mapping buildings.
Read more
.png)
NASA Lifelines: Humanitarian Simulation, WASH (Water, Sanitation, and Hygiene)
The Lifelines Humanitarian Simulation is a collaborative game that takes a real-world scenario and challenge teams to work together to collaborate in the mock crisis context in Democratic Republic of the Congo. My role was an analyst in WASH (Water, Sanitation, and Hygiene) team. I supported team’s water mission with analysis and map-making, also provided inputs for daily briefing. I was responsible for interpreting data and providing water analysis based on evidence. This role ensure that the humanitarian response is data-driven and meets the technical standards required.
Read more
.png)
Guest speaker, Next Generation Cartographer(NGC)
On 12 February 2025, a community meet-up had a topic of how AI can support map making! 🗺️🤖 Parinda Pannoon shared insights from her research on how prompt engineering in ChatGPT can be used in the context of code generation to create thematic hashtag#maps in Python. 🖥️ Let us tell you: it takes a lot of prompts and iterations to produce a decent thematic map with ChatGPT & Python!
Read more
.png)
Excursion : Digital Mindset in AI4EO Perspective
Humans have applied a digital mindset to the field of Earth observation since there are massive data of satellites and GIS that allow us to leverage them. Therefore, a digital mindset has an impact on scientists and policymakers to harness this wealth of data and extract meaningful insights to inform decision-making processes.
Read more
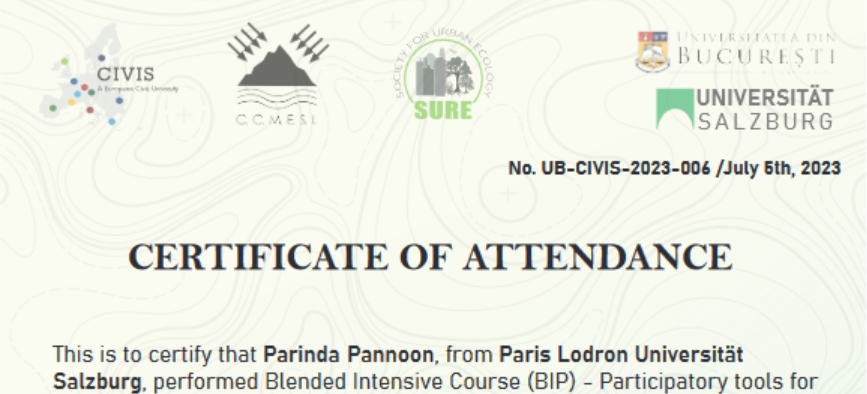
Summer school : Participatory tools for urban nature planning and management
This summer school program discussed about concepts, methodologies, and best practices related to participatory tools for urban nature planning and management. This helps me to understand better the challenges of public participation in urban areas. Topics focused on public participation in urban nature and urban sustainability which integrated geoinformatics applications to solve societal challenges in our cities.
Read more
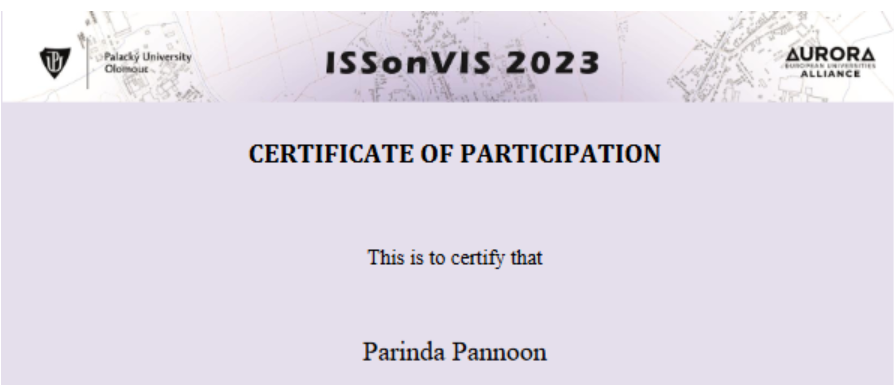
Summer school : International Spring School on Visualization 2023 (ISSonVIS)
The program focused on warfare, not only in the context of today’s events, but also retrospectively into history. Moreover, the course aimed to provide perspectives about the use of maps in wartime, the importance of spatial intelligence as well as contemporary ways of war reporting and the use of visualizations from geospatial information. The SSonVis is subdivided into lectures, guided practices and edutainment sessions. The concept of the summer school is set up to be open to both geoinformatics and humanities students with no limitation on their level of study.
Read more